Sunday, January 31, 2016

The First Assessment Report's Projection for Sea Level Rise (pretty good)

A comment brought up the UNEP and United Nations University 2005 forecast that 50 million people could become environmental refugees by 2010.

I've never actually seen the real number, and the commenter didn't give one, but 50 million certainly seems likely to have been a vast overstatement.

But the actual science has been quite good. Consider this: the IPCC's First Assessment Report (1990) includes projections of sea level rise for the period 1985-2030 (Ch9 Table 9.10 pg 276):


(This looks like a digital scan of the all the original, and apparently the decimal points didn't cut it.)

How does this compare to reality? Well, it's not 2030 yet, but Aviso data on sea level show an average rate of (linear) change for the 22.8 years of their data (1993.00 to 10/25/15) is 3.34 mm/yr. So for the 45 years considered in the FAR above, that works out to a projection (if linear) of 15.0 cm.

Compare to their "best estimate" of 18.3 cm. Pretty damn good, especially when you consider that the scientific projections, which aren't linear as they include sea level rise acceleration, will likely be more than my number, so closer to the "Best Estimate" above, if not beyond it.

It's undoubtably very difficult to project what people will do in response to specific aspects of climate change -- there aren't many laws or equations in sociology. The UNEP and UNU were probably reckless in making such a projection, even over a short time period. It would be interesting to understand how they were so wrong, and der Spiegel does some of that here.

But the science here looks quite impressive.

Friday, January 29, 2016

Your Body Is Not as Disgusting as You Thought

Eurekalert:
How many microbes inhabit our body on a regular basis? For the last few decades, the most commonly accepted estimate in the scientific world puts that number at around ten times as many bacterial as human cells. In research published today in the journal Cell, a recalculation of that number by Weizmann Institute of Science researchers reveals that the average adult has just under 40 trillion bacterial cells and about 30 trillion human ones, making the ratio much closer to 1:1.
This new calculation was done for a book called Cell Biology by the Numbers,which looks really interesting and right up a physics student's alley. Unfortunately, just the paperback version is $49.95 at Amazon.

Thursday, January 28, 2016

Marco Rubio: For Cap-and-Trade Before He Was Against It

Marco Rubio just lied in tonight's Republican debate, saying "I've never supported cap-and-trade."

He did. It's so easy to find, it's amazing (and disappointing) he would ever try to deny it:


Added: Slate found another Rubio lie flip-flop lie.

Subsidies for Wind and Solar Power

Someone on a discussion forum I was reading wrote that solar power is subsidized by 96 cents per kilowatt-hour. (By comparion, the average US price for electricity is 12-13 cents/kWh.) That seemed unbelievable to me, so I thought I'd check it out. More or less, it's true.

Here are some numbers -- some recent subsidies for fuels that generate electricity, and electricity generation by source back to 1973.


So the subsidies for solar are indeed very high, and for wind they're about 25%.

Is this a problem? I don't think so. The negative externalities of wind and solar corrected 3/16: fossil fuels -- what they cost that doesn't show up in consumer's monthly bills -- are huge, especially for coal. Mercury emissions that poison streams and can have neurological impacts on infants, SO2 emissions that create acid rain, contributions to ground-level ozone, particulate matter that gets in lungs, and so on. And that's not to mention the damage to miners themselves -- coal miners suffer more fatal injuries than any profession in America. Nor does it include the devastation of mountaintops in eastern coal mining states like West Virginia.

The public pays almost of these costs, while coal companies keep the profits -- a nice form of socialism for them, or as I once put it, from each according to their smokestack, to each according to their lungs.

The report

“Hidden Costs of Energy: Unpriced Consequences of Energy Production and Use” 
National Research Council, 2010

found the cost from damages due to fossil fuel use to be $120B for 2005 (in 2007 dollars), a number that does not include climate change and that the study’s authors considered a “substantial underestimate.” For electricity generation by coal the external cost was 3.2 cents/kWh, with damages due to climate change adding another 3 cents/kWh (for CO2e priced at $30/tonne). Transportation costs were a minimum of 1.2 cents/vehicle-mile, with at least another 0.5 cents/VM for climate change. Heat produced by natural gas caused damages calculated to be 11 cents/thousand cubic feet, with $2.10/Kcf in damages to the climate. They found essentially no damage costs from renewables. (Yes, some bird deaths – but fossil fuels kill far more birds than do wind turbines.)

This is money we’re all paying in medical costs (and compromised health), and US governments now pay about half of all medical costs. 

Generating power with coal and oil creates more damage than value-added, according to a 2011 paper, with William Nordhaus (once the economist of choice for contrarians) one of the co-authors: 

"Environmental Accounting for Pollution in the United States Economy," Nicholas Z. Muller, Robert Mendelsohn, and William Nordhaus, American Economic Review, 101(5): 1649–75 (2011).

Summarizing that paper's findings: for every $1 in value that comes from coal-generated electricity, it creates $2.20 in damages. Total damages: $70 billion per year (in 2012 dollars).

Petroleum-generated electricity is even worse: $5.13 in damages for $1 in value.

In other words, according to this study, generating power with coal or oil actually sends the economy backwards.

In view of damage costs from fossil fuels of at least $120 B/yr -- which was for 2005, and I haven't tried to update it -- do subsidies for wind and solar pay off?

The numbers say it would now pay off for wind, but not for solar:


So the US could save ~ several tens of billions of dollars a year by generating all our power with wind, even when subsidized.

But good luck explaining this to people who object to renewables on the grounds that "the poor can't afford it" (like Roy Spencer is fond of doing). Well, we could subsidize the bills of the poor, but that's no excuse for you or me or someone with a nice professor's salary like Roy Spencer not to pay for clean electricity. I buy 100% green offsets from my power company, Pacific General Electric, at a cost of $0.008/kWh. It costs me about $2.20/month, or an extra 5%.

Wednesday, January 27, 2016

Dangerous Heat Waves in the Persian Gulf

Here's an nice clean graph from a new news article in Nature Climate Change by Christopher Schär, showing the extent of last summer's heat wave in the Persian Gulf.

"It was one of the worst heat waves ever recorded," the article says. Temperature peaked at about 46°C (115°F), but it's the red line that is most important: the wet bulb temperature. Wikipedia says
The wet-bulb temperature is the lowest temperature that can be reached under current ambient conditions by the evaporation of water only.
It's relevant to human health, because when the wet bulb temperature gets near body temperature (37°C), our natural cooling system -- ventilation and sweating -- is disabled.

A wet bulb temperature above 35°C is dangerous. As the article notes, it's not just the elderly and ill who are at risk in such heat waves -- everyone is, "even young and fit individuals under shaded and well-ventilated outdoor conditions."

This article is about another Nature Climate Change article last August by Pal and Eltahir that projected wet bulb temperatures in the future. Schär writes:
Although TW = 35 °C is never reached under current climatic conditions in their simulations, it is projected to be reached several times in the business-as-usual 30-year scenario period in Bandar Mahshahr and Bandar Abbas (Iran), Dhahran (Saudia Arabia), Doha (Qatar), Dubai and Abu Dhabi (United Arab Emirates), and probably in additional locations along the Gulf that have not been specifically investigated. 
And this sounds truly out-of-this-world:
Furthermore, temperatures are projected to reach unacceptable levels; for instance, in some years of the scenario period T = 60 °C will be exceeded in Kuwait City. The rise in temperature and humidity would thus be likely to constrain development along the shores of the Gulf.
60°C is 140°F.... That's hard for me to even imagine.

In the mid-1990s I lived in Tempe, Arizona for a year and a half. There were many summer days when the high temperature was above 110°F, and the hottest day I remember was 122°F. (They closed the airport that day because they didn't have specs on how well their planes fly above 120°F.) Still, I was able to ride a bike around during the middle of the day for a mile or two without much trouble -- but with much sweating afterwards -- but the humidity was low and I was younger and did a lot of hiking back then.

Winter there was perfect, temperature-wise, but the summer heat gave me cabin fever, because life always seemed like a dash from one air-conditioned place to another. I found it especially strange to go outside at 10 pm where temperatures were still 100°F or so.

The Persian Gulf, though, seems to be more humid, because the Gulf is shallow and very warm. Schär says that from 1990-2010 the Gulf region warmed at a rate of +0.47°C per decade.

Doubling Times for Ocean Heat Content

This figure is from the recent paper in Nature Climate Change by Peter Gleckler et al, "Industrial-era global ocean heat uptake doubles in recent decades." The long-term acceleration in the rate of heat gain is obvious -- another unsurprising hockey stick.

First, it's interesting to see the effects of large volcanic eruptions on ocean heat content, leading to clear, smoother and noticeable changes in ocean heat content (OHC) for the 0-700 m region. Ocean warming really is the best way to measure a planet's energy imbalance.

Is the OHC of the 0-700 m region still increasing exponentially? Or is it now linear?

While I don't have all of that paper's data handy, I thought I could easily do something similar with the NOAA data I do have. In the following plot, I graphed the doubling time for heat content for the 0-700 meter region:


So, for example, the 0-700 m heat content the last quarter of 2015 (last data point) has doubled from 13.3 years ago.

In 1995, it had doubled from 10 years earlier. In 2010 it was double that of about 11 years earlier. Etc.

So the doubling time isn't quite constant -- it's increasing slowly with time. If it was constant, the change would be exponential -- as would its rate of change -- which is must faster than a second-order polynomial which gives a constant acceleration.

Sunday, January 24, 2016

More Warming: Latest Data for Ocean Heat Content

NOAA just released data on ocean heat content for the 4th quarter of 2015 -- the best evidence, many now say, of a planetary energy imbalance. The trends continue:


Global Ocean Heat Content 1955-present 0-700 m


Global Ocean Heat Content 1955-present 0-2000 m

Compared to 12 months earlier, the 0-700 meter region of the ocean has gained 0.94 W/m2, and the 0-2000 meter region 0.71 W/m2.

Usually the larger region (0-2000 m) gains more heat than the smaller region (0-7000 m), but not this time. Perhaps that's due to El Nino -- the same happened in the latter part of 2010, which was also an El Nino year.


The (tenuous) acceleration of heating drops a hair: +1.5 ZJ/yr2, or +48 TW/yr2, or +0.09 W/m2/yr (for the top 2,000 meters). (ZJ = zettajoules = 1021 J; TW = terrawatts = 1012 W.) I'm trying to understand how to include autocorrelation for a polynomial fit, and will post that if I do.


Saturday, January 23, 2016

Largest Prime

A computer at the University of Central Missouri -- and the mathematician there, Curtis Cooper, who has 800 machines running looking for primes -- has found the largest prime number known to-date:  274,207,281 − 1. It's called a Merseene prime, because it's of the form 2M-1. It's about 22 million digits long, abou t5 million more than the previous record, and written out it comes to this ridiculous thing that begins with

three hundred septenmilliamilliaquadringensexquadraginmilliaduocenquattuortillion...  

Numberphile shows how it was done, and says anyone can download the search program and run it. (You can even win money.)


By the way, appx 2,300 years ago Euclid proved, very simply and elegantly, that there are infinitely many prime numbers. There are other proofs as well.

I wanted to understand how to calculate how many digits this new prime has.

It's pretty clear that the number of digits d(N) for any number N is (in base 10)

d(N) = INT[log10(N)] + 1


where INT(x) returns the integer portion of the number x -- everything to the left of its decimal point. For a Merseene prime this becomes

d(M) = INT[log10(2M-1)] + 1


However, we can't readily compute 2M -- it's too large, but after thinking awhile here's what I came up with:

No power of 2 has a last digit of 0 (easy to prove via induction), so the last digit of 2M does not end in zero. 2M is even, so its last digit is either 2, 4, 6, or 8. So 2M -1 has a last digit of 1, 3, 5, or 7, but not 9 because 2M never has a last digit of 0. (It also can't end in 3 or 5, because it'd be evenly divisible by the same integer; unless it was 3, which is the first Mersenne prime.) So the last digit of 2M-1 can only be 1 or 7.

Hence, the integer part of log10 of 2M-1 will be the same as the integer part of log10 of 2M. So

d(M) = INT[log10(2M)] + 1 = INT[Mlog10(2)] + 1

which is easily calculated -- in this case it comes to 22,338,618.

Wolfram has a list of Mersene primes, with strings of their first several digits and last several digits. Sure enough, they all end in 1 or 7.

Interesting:  If 2M-1 is prime, then M is prime. Slate says the 11 largest known primes are all Merseene primes (and the article has other interesting facts about primes). Notably, it has been conjectured ther are an infinite number of Merseene primes, but not proven.

Prime numbers are interesting and weird. Statements about them are often easy to make, but very difficult to prove. They leak into other important areas of mathematics, like Riemann's Hypothesis. It almost seems like there is some hidden part of the geography of all mathematics, relatively simple and straightforward and, like a lost city, just waiting to discovered behind a towering mountain pass. Some 22-year old genius in the year 2273 will finally bridge the gap by going around the pass, not over it, opening up a whole new world.

Thursday, January 21, 2016

Too Good Not to Post

There were a couple of graphs from yesterday that are too good to pass up. First, from Gavin Schmidt:


From Zeke Hausfather -- the raw data also set an annual record:

Embedded image permalink

Friday, January 15, 2016

Thanks

I'm gonna take some time off to do other things. 
Maybe a day, maybe a week, maybe a year or perhaps even a decade.
Thanks for reading. See you later.
 

Thursday, January 14, 2016

Gilmanton NH in January

There's nothing I've ever found that is like New Hampshire in January. It is nothing but white everywhere, frozen solid, very crisp and, like the picture below, often very clear. I've never known anything else like it. Temps down to -15 F and -20 F, daytime highs in the upper single digits.

It is cold. It is frozen and white, deeply. It is truly like a different world, and those are really hard to find.

From my friend Ann:


Want a Real Conversation? You Got One.

Ted Cruz: Your "18 Years" of No Satellite Warming is in Mortal Danger

The claim that there has been no global warming for 18 years is about to end.

It should end in early February, when UAH releases their anomaly number for the lower troposphere. (Here I'll focus on UAH's LT data.)

Of course, this claim has always relied on anti-scientific cherry-picking: choosing your starting point to get the result you want, whether it's scientifically meaningful or not. As I wrote here, the claim of "18+ years of no warming" relies completely on the warming spike of the 1997-98 El Nino. If that event (= natural variability) had never happened, this "pause" wouldn't now being occurring.

But now, even that strong influence is being overtaken by higher temperatures.

Here are the numbers:


Red shows the "reverse warming" of the lower troposphere according to UAH -- the warming from any point on the x-axis to present.

As you can see, the "pause" in LT warming relies on a very careful cherry pick -- starting your calculation near the dip early in 1998.

Early this February, UAH will release their anomaly number for January 2015. As long as it is +0.51 C or larger, the warming (blue line) will no longer start in negative territory for any date in the past.

The "pause" will disappear.

Will January's LT anomaly reach 0.51 C? It'd better, or UAH's model is going to look awfully suspicious. Because during the 1997-98 El Nino, UAH LT anomalies increased drastically in the first few months of 1998:


So there's good reason to think UAH LT anomalies -- which so far have been larger than in 1997-98 (= probably AGW) by about 0.2 C, should easily be above 0.51 C this month.

Will Chris Monckton, Werner Brozek and the usual suspects find a way to keep the pause going? Probably, using error bars or statistical tricks. It will be fun to watch.

But it will be grasping at straws.

Note: I'm putting the "Numerology" logo atop this post because this kind of analysis has always been numerology, not real science. Live by numerology, die by numerology.

Have Gravitational Waves Been Detected?

#LIGO
Since Monday, when Lawrence Krauss tweeted and confirmed a rumor, there is a lot of traffic repeating and questioning the rumor that LIGO has detected gravitational waves.

It's worth emphasizing that there is little-to-no doubt that gravitational waves exist. That evidence is very strong, though indirect.

As I wrote about for Physics World a few months ago, after visiting LIGO's Hanford facility in Washington state, Einstein's equations of general relativity predict that gravitational waves should be emitted by any object (mass, or pure energy) in motion. But these waves aren't sine waves, like the canonical image of electromagnetic waves we all have, self-propagating through space.

That's because there is only one type of mass -- positive -- whereas there there are two types of electric charge -- positive and negative. So unlike for electric charge, there is no "dipole moment" for mass.

Instead, a "quadrupole monent" is the simpliest gravitational wave.

I'm not going to write here exactly what this means technically. But it does mean that gravitational waves are unlike other waves that we're used to. As they move through space, they squeeze it in one dimension, but expand it in the other.

The analogy I used was that of puckering up, and puckering down, for a kiss -- your top and bottom lips go up and down, while the side of your mouth comes in and out.

The indirect evidence for gravitationl waves was made by Joseph Taylor Jr and Joel Weisberg, utilizing a new type of pulsar discovered by Taylor Jr. and Russell Hulse in 1974. They won the Nobel Prize for the discovery of that pulsar. (See the "Pulsar Detectives" box on the second page of my article).

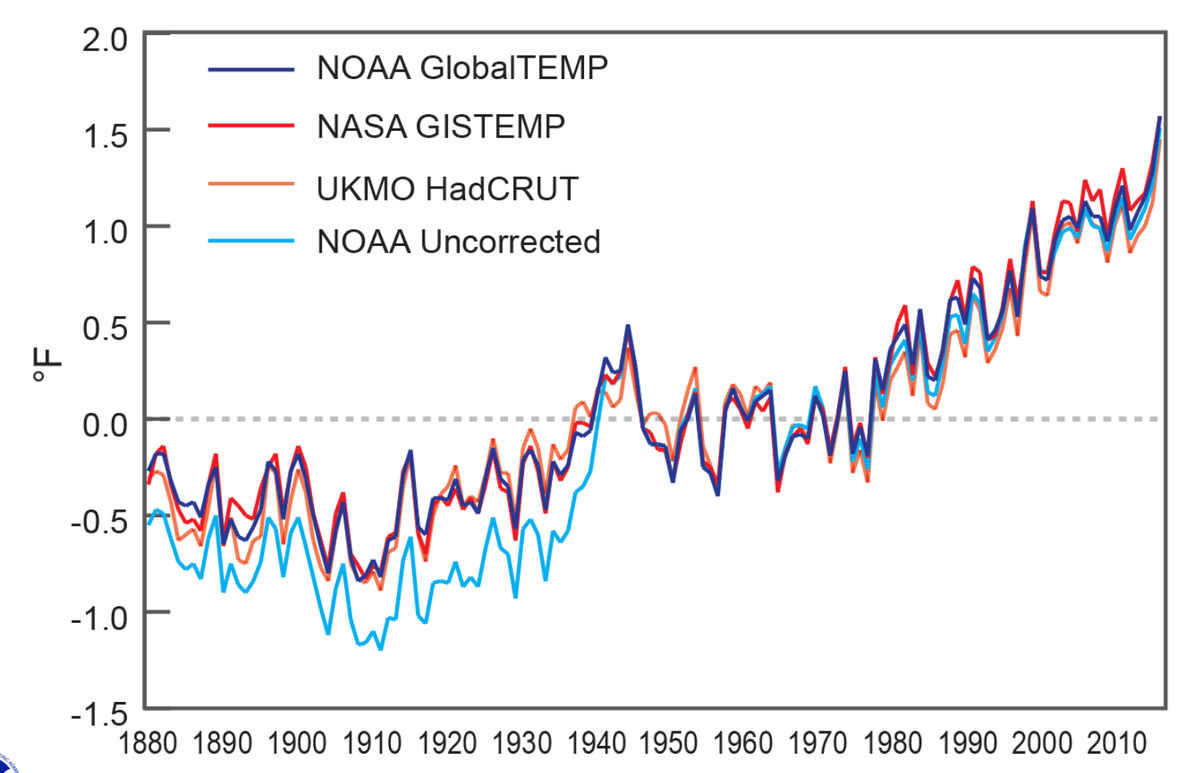
As you'd expect, a pair of stars orbiting around one another would get closer and closer, and the energy they lose is released as gravitational waves. This can be calculated from Einstein's equations -- it's not as easy calculation, by any means, but it is straightforward -- and that prediction is in spectacular agreement with what was observed by Hulse and Taylor's stellar pair. (See graph to the right.)

It's worth nothing that that, while Hulse and Taylor discovered this special pulsar as part of a pair, it was Taylor and Weisberg who showed that its decaying orbit was in agreement with Einstein's prediction. People often get this wrong. Perhaps Weisberg should have gotten the Nobel Prize too.

But while we know gravitational waves exist, detecting them directly, as LIGO is trying to do, would still be a big deal. Gravitational scientists hope that detection of gravitational waves might soon become routine, just as detecting stars via visible light and radio waves and x-rays is routine today.

If so, this would provide astronomers with a new "sense," a new way of not unlike how hearing is a different sense to seeing.

Those new senses brought about a truly new view of the universe -- from the placid, steady state found by Hubble et al, to the wild and racuous view of stars and galaxies we know today.

Direct detection of gravitational waves could inspire the the same type of shift.

If this detection is true -- and Lawrence Krauss backed off a bit on Tuesday -- it suggests that detecting gravitional waves directly could be easy with Advanced LIGO, their latest and last-planned upgrade, since they just started running their machine in full detection mode this past autumn.

This massive tomb is its own black hole.
A direct detection would defintely be a most important result here -- easily worthy of a Nobel Prize for trhe project leaders and also especially to Kip Thorne (now retired from Caltech, and an advisor on the movie Interstellar), who has been pushing for the LIGO machine since Day One and was instrumental in not just getting the project going way back in the 1980s, but who has fundamental to its design since then.

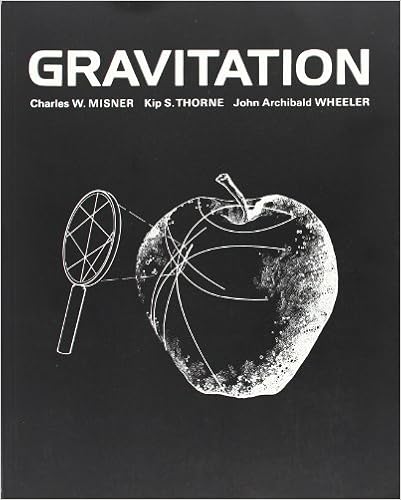
As a theorist, Thorne has had a powerful influence on the progress of general relativity since the 1970s. All real students of science, at least my generation, drag around his 5.6 lb textbook published with Charles Misner and John Wheeler in 1973. (I used to say its cover was black because no light would possibly escape its huge mass.)

Thorne should definitely win the Nobel Prize, especially if LIGO has really detected gravitational waves. I'm not sure who else would get it, on the experimental side. On the theoretical side, I think Stephen Hawking and Roger Penrose deserve it too, but it's unlikely the Nobel committee would award it to three theorists and at least one LIGO experimentalist.

Tuesday, January 12, 2016

Maybe the Best Speech I Have Ever Heard

I usually can't stand political speeches, full of false words and sanctimony, but President Obama's State of the Union speech tonight was one of the best, most straight ahead, most hopeful speeches I have ever heard. This is his last SOTU, and he knew he was free to say whatever he wanted, and he did. I thought this was especially good:

From the Huffington Post:
President Barack Obama dissed those who deny the science around climate change during his last State of the Union address.
"Look, if anybody still wants to dispute the science around climate change, have at it," Obama said. "You’ll be pretty lonely, because you’ll be debating our military, most of America’s business leaders, the majority of the American people, almost the entire scientific community, and 200 nations around the world who agree it’s a problem and intend to solve it."
Obama touched on the topic while speaking on innovation, saying we need to tap into the "spirit of discovery" in order to solve some of "our biggest challenges."
"Sixty years ago, when the Russians beat us into space, we didn’t deny Sputnik was up there," Obama said. "We didn’t argue about the science, or shrink our research and development budget. We built a space program almost overnight, and twelve years later, we were walking on the moon."

Sea Surface Temperatures Blow Away Existing Record

Today the Hadley Centre posted its anomaly for December -- it's here -- and 2015's annual average completely destroyed the previous record -- 2014's -- by 0.11°C.

Coming in third is the El Nino year of 1998, at 0.17°C below 2015's value.

This is a huge jump, almost a decade's worth of warming in just one year. (The 30-year trend for HadSST3 is +0.135°C/decade.)


Thursday, January 07, 2016

This El Nino's Lower Troposphere Temperature, Compared to the Past

Here is a nice, relevant plot from Sou at Hotwhopper: it shows UAH's calculation of the lower troposphere temperature anomaly, for this El Nino, 2009-2010's, and 1997-98's.

This year is significantly ahead:


And here's an update to an (admittedly confusing) graph I've given before: a comparison of surface temperatures during this El Nino, compared to 1997-98.


Even though the strength (dashed lines, left-hand axis) of the respective El Ninos is comparable, with this year just a little ahead of 1997-98's, surface temperatures (solid lines, right-hand axis) are consistently higher by 0.2-0.4°C. There's your global warming.

2015's key climate science research advances - Yale Climate Connections

http://www.yaleclimateconnections.org/2016/01/2015s-key-climate-science-research-advances/
  

I'm Sorry, But I Really Like This

(Except for the part about being in captivity, of course.)

Man Tries To Feed Medicine To Pandas. Pandas Have Other Ideas


Via Wimp.com

Wednesday, January 06, 2016

Lower Troposphere "Pause" is Purely an Artifact of 1997-98 El Nino

With each month's measurements of the temperature anomaly of the lower troposphere comes the by-now standard claim that "there's been no warming for 18 years and X months." X varies a little -- but it doesn't seem to get bigger with time.

It's straightforward to show that this "pause" in the LT is purely a product of the 1997-98 El Nino -- that is, of natural variability. It would not exist without it, if everything else stays the same.

In the following graph I plot what I call the "reverse trend" -- the trend from any year on the x-axis to today. So, for example, the graph shows that the trend from 1983 to 2015 is 0.12°C/decade, and from 2003 to today is 0.04°C/decade. (There are error bars, but the point made here doesn't depend on them so I'll leave them off.)

The red line is the actual measured temperature anomalies. (I used annual averages to keep this simple.) The blue line assumes simply there was no big El Nino spike and that 1998's anomaly was the average of 1997's and 1999's.


As you can see, the "pause" for the actual data -- the red line's dip to slight negativity in 1998 -- depends closely on choosing 1998 as one's starting point. That's precisely the definition of a "cherry pick" -- choosing the starting point to give the result one wants, regardless of its scientific legitimacy or whether it is long enough to represent climate, and not natural variability.

The blue line, with no 1997-98 El Nino, shows no pause at all at that point. In fact, it's never negative for any starting point before 2015.

As expected, the trend over climatically representative intervals, such as the 30 year period 1985-2015, is essentially identical to that which includes the natural variability of that big '97-98 El Nino. El Ninos and La Ninas balance out over the long-term. (They're not the only natural factors that can have an influence, of course -- volcanoes and changes in solar irradiance do too -- but no need to include them here to make the point.)

And shorter trends, of about 10 years or less, aren't statistically significant, and usually not even close to being statistically significant.

The lower troposphere "pause" over 18 yrs X months is purely an artifact of a big El Nino -- that is, of natural variability.

Note added 9:00 pm: A commenter asked a good question: what about the other El Ninos that have occurred since? The average of the monthly MEI (Multivariate Enso Index), an ENSO proxy, from Jan 1999 to present is 0.04, very close to neutral. (For example, 1997's MEI was 1.58. 2015's is 1.59.

In other words, La Ninas and El Ninos have tended to cancel out since 1999. So it's not a bad assumption to take the data as it is, excepting only the 1997-98 El Nino. But it's not a perfect assumption, as one would still need to account for ENSOs before 1999 -- the average MEI from January 1979 to December 1996 is 0.48.