From the month's U Maine reanalysis data, I estimate GISS's global anomaly for May will be +0.83°C.
That'd be a record-high for the month, smashing last year's record of +0.77°C, and the 6th-warmest of any month since GISS's records began in 1880.
It would also bring the warming in 10 years up to +0.08°C, in 15 years to +0.14°C, and in 30 years to +0.49°C. Seems the Pause is itself pausing.
My estimate last month for April (0.66°C) wasn't very close to the actual value (0.75 0.71°C), and but the relationship between the estimate from reanalysis data and the actual GISS anomaly isn't a strict linear fit:
so don't take my number to the bank.
Nota bene: Turns out GISS corrected their numbers a few days after they first came out (May 15th), which I didn't catch, which explains why I had some incorrect some numbers above. Their new numbers don't change my estimate for May.
Asked about the role of climate change in the floods, U.S. Sen. Ted Cruz declined to weigh in Wednesday. "At a time of tragedy, I think it's wrong to try to politicize a natural disaster," the Republican presidential candidate said during a news conference in San Marcos after surveying damage.
El Nino is kicking into a higher gear, though not as fast as recent El Ninos at this point in the year:
Here's the historical record of the Nino 3.4 index, which is the temperature anomaly in a region in the equatorial Pacific Ocean where El Ninos take place. El Ninos are in red, though not all the red areas are El Ninos -- the Nino3.4 index needs to be above 0.5 for five consecutive months for an El Nino to be declared (though that's not a universal criterion, I think):
That's from the International Research Institute for Climate and Society at Columbia University. Here's their collection of forecasts for the Nino3.4 Index:
It seems that some plants aren't getting the message that they're supposed to be thriving in a higher-CO2 world.
A recent study (open access) of grasslands in a Montana meadow found that productivity decreased 50% in 40 years (1969-2012), despite a 21% increase in atmospheric CO2.
Why? Because natural plants don't live in a tidy little greenhouse, where the CO2, temperature and precipitation aren't precisely controlled. From the paper in Nature Communications, by Brookshire and Weaver:
ANPP = above-ground net primary production. "Production" means how much plant mass is created from photosynthesis, measured in this paper in grams per square meter per year. "Primary" refers to plants, who fix carbon, as opposed to the secondary production of heterotrophs, who can't fix carbon and gain energy by eating other things. (So you're a heterotroph.)
Here's the measured decline in primary productivity in this Montana meadow (click to enlarge):
The Daily Climate has a nice article on this (click to enlarge). From it:
This is in-line with several papers I've seen that show CO2 isn't an unalloyed good when it comes to plants -- "Carbon dioxide, we call it life"claim is grossly simplistic, because plants must also content with temperature changes, precipitation changes, and more.
Some of these studies:
“Nitrate assimilation is inhibited by elevated CO2 in field-grown wheat,” Arnold J. Bloom et al, Nature Climate Change, (April 6 2014). As Bloom said on Yale Climate Connections, “Higher CO2 tends to inhibit the ability of plants to make protein… And this explains why food quality seems to have been declining and will continue to decline as CO2 rises — because of this inhibition of nitrate conversion into protein..... “It’s going to be fairly universal that we’ll be struggling with trying to sustain food quality and it’s not just protein… it’s also micronutrients such as zinc and iron that suffer as well as protein.”
“Global scale climate–crop yield relationships and the impacts of recent warming," David B Lobell and Christopher B Field, Environmental Research Letters Volume 2 Number 1 (2007). “For wheat, maize and barley, there is a clearly negative response of global yields to increased temperatures. Based on these sensitivities and observed climate trends, we estimate that warming since 1981 has resulted in annual combined losses of these three crops representing roughly 40 Mt or $5 billion per year, as of 2002.”
"Increasing CO2 threatens human nutrition," Samuel S. Myers et al, Nature 510, 139–142 (05 June 2014). "Dietary deficiencies of zinc and iron are a substantial global public health problem. An estimated two billion people suffer these deficiencies, causing a loss of 63 million life-years annually. Most of these people depend on C3 grains and legumes as their primary dietary source of zinc and iron. Here we report that C3 grains and legumes have lower concentrations of zinc and iron when grown under field conditions at the elevated atmospheric CO2 concentration predicted for the middle of this century. C3 crops other than legumes also have lower concentrations of protein, whereas C4 crops seem to be less affected. Differences between cultivars of a single crop suggest that breeding for decreased sensitivity to atmospheric CO2 concentration could partly address these new challenges to global health."
"Effect of warming temperatures on US wheat yields," Jesse Tack et al, PNAS, (April 20, 2015). "We also find that the overall effect of warming on yields is negative, even after accounting for the benefits of reduced exposure to freezing temperatures."
"The fingerprint of climate trends on European crop yields," Frances C. Moorea and David B. Lobell, PNAS vol. 112 no. 9, 2670–2675 (2015). "Agriculture is one of the economic sectors most exposed to climate change impacts, but few studies have statistically connected long-term changes in temperature and rainfall with yields. Doing so in Europe is particularly important because yields of wheat and barley have plateaued since the early 1990s and climate change has been suggested as a cause of this stagnation. Here, we show that the impact of climate trends can be detected in the pattern of long-term yield trends in Europe. Although impacts have been large in some areas, the aggregate effect across the continent has been modest. Climate trends can explain 10% of the slowdown in wheat and barley yields, with changes in agriculture and environmental policies possibly responsible for the remainder."
Added 6/8/15: Wood for Trees has been updated, per a comment below. The developer and maintainer asks that, if you like WFT, you consider leaving a tip here: https://www.justgiving.com/WFT/
A lot of people like linking to graphs on Wood for Trees, for plots like the one at the right.
Except WFT is using some bad data.
Here are the raw data used to make the chart on the right.
The problem is, these data only go up to decimal date 2014.5, when the current HadCRUT4 data goes up to March 2015.
Second of all, their anomalies aren't current. Here are their first three data points for the graph at right, starting in 2010:
20100.545
2010.080.558
2010.170.668
Here are the actual current first three data points they should be using:
2010.040.559
2010.130.572
2010.210.677
The WFT raw data output says their data comes from http://www.metoffice.gov.uk/hadobs/hadcrut4/data/download.html . Problem is, right now that page returns "Not Found."
So where is WTF getting their data? And why isn't it current?
Then there's the small problem of their decimal dates. For January 2010, for example, they should be using the mid-point of the month, instead of the beginning.
So in the list up above, "2010" should actually be, for January (month=1) of that year, 2010 + (1-0.5)/12 = 2010.042. It's a small error, but it's still an error -- it will lead to end-point errors.
--
I have never really trusted Wood for Trees, and never cite it. (I prefer to download the data and calculate for myself.) For example, their Credits page doesn't specify which version of UAH they are using, though its seems at most to be v5.6, when UAH is now on v6.0beta2. Perhaps they are waiting to see if that version persists, but not long ago I noticed WFT offering UAH v5.5 when v5.6 had been out for awhile.
Wood fore Trees is a good idea. But it doesn't look to be maintained or current. And, as the above shows, it's not even clear where it's getting its data from.
If someone quotes you something from WFT, be skeptical, and double check what data it's using.
"The physics behind that [greenhouse gases] causing warming are the same physics that the Air Force used to put sensors on heat-seeking missles. In some really fundamental sense, if you deny the global warming effect of our CO2 you are claiming the Air Force doesn't konw what to put on their heat seeking missles. It's absurd."
The Pause (seepage or not; real or not) looks to be ending. Here is the amount of warming in the previous 10 years (120 months), according to NASA GISS:
So in the last 120 months the surface has warmed by +0.08°C. If the rest of 2015 is the same as its first four months, this will be +0.17°C by the end of the year, and set an annual record by a whopping 0.11°C.
Of course, that's a sizeable if. But, with the El Nino, it's not clear the remaining months won't be higher than those so far.
--
PS: Labeling this "numerology" gets me out of calculating error bars, statistical signficance, and all that. Just like 99.8%* of all blog posts.
* This number is also numerological -- I guessed. See how easy this is?
PPS: Using the UMaine reanalysis data for the first half of May, my guess for GISS's anomaly for the first half of May is +0.82°C. Past months at this point have changed by up to ±0.1°C, but on average about half that (in absolute value). But my guess for April (+0.66°C) was not especially good (actual GISS value was +0.75°C), so caveat emptor.
While it’s difficult to calculate the carbon footprint of a single bouquet, experts estimate that sending 100 million roses (the number believed to be given in the United States on Valentine’s Day, another big flower holiday) produces some 9,000 metric tons of carbon dioxide emissions from field to florist. The average American household has a carbon footprint of 48 tons a year.
These emissions come to 187.5 households, or 90 grams of CO2 per rose, or what the average American emits in 2.8 minutes.
We're supposed to feel guilty about this 187.5 households' worth, this 3 minutes worth, out of 123 million households in the country, out of all the minutes (525,960) in a year. Maybe it's twice this, because there is both Valentine's Day and Mother's Day.
This is not the way to solve climate change. Or the way to think about it.
You could pick up a rock outside your mother's front door and give her that for Mother's Day, and its carbon footprint would be close to zero. (Some of the energy you use to pick up the rock came from the food you ate, which takes fossil fuels to grow.) But it will make no difference to climate change.
But your mother will take it personally. And I don't blame her one bit. So don't be an idiot about it.
In the light of Obama's disappointing decision about Arctic oil drilling, I was wondering what is really at stake. How much oil is up there?
Of course, that's not the only relevant factor. It's a difficult environment in which to drill, and Shell has had problems with proof of principle.
So there are no doubt oil spills to look forward to. I mean, no one really cares about seals and polar bears, right? (I'm serious.) Imagine the clamor if people couldn't drive to work tomorrow for lack of gas. (I'm serious.)
But what is the climate impact?
Ernst and Young, who are supposed to be good at tallying numbers, says (pg 2)
The USGS assessment concluded that approximately 90 billion barrels of oil, 1,669 trillion cubic feet of gas, and 44 billion barrels of natural gas liquids (NGLs) may remain to be found in the Arctic. Of the total 412 billion barrels of oil equivalent (boe), approximately 84% is expected to be found offshore, and about two-thirds (67%) of the total was natural gas.
Let's just focus on the oil for the moment.
The US is now producing just shy of 15,000 thousand barrels a day, so 80 billion barrels would be 16 years worth of current US oil production. At $60 per barrel, its market price is over $5 trillion.
That's a lot of resource. I don't know what it costs to drill a barrel of oil in the Arctic, but it could do wonders for a stock price. Shell must think so, though I suspect they aren't anticipating oil stays at $60/b.
The energy content would be 6e20 Joules, about 5 times the fossil fuel energy the US consumed last year.
The carbon emitted from burning it would be about 11 billion tonnes, about 7 times what the US emitted last year from burning fossil fuels.
The World has emitted about 405 GtC from burning fossil fuels, so far. The Arctic oil is 3% of that.
--
Of course, I don't know why Obama made this decision. My best guess would be he's trying to set up Hillary for 2016. (I've already decided I won't vote for her, but then I can do that, since I live in Oregon and she will easily carry the state anyway. My vote doesn't count, thanks to the electorial college. (What a (representative) democracy this is, huh?))
Still, it's disappointing. Scuttle Keystone XL, with its 700,000 barrels per day (2.6 Bb per decade, = 1.1 gigatons of CO2 per decade), then unleash up to 40 billion tons of CO2 into the atmosphere.
IF anything, this proves no leader we elect is going to address climate change, not really, no matter what they say. How are they going to turn down $5 trillion in profits? And probably once in office they learn things -- like what the hell would happen if the US ran even a few percent short of the oil it consumes, with the surely inevitable riots over cheese and cat food -- and give in to the corporate powers who do know what the hell would happen. It keeps the wolves at bay.
Plus, the revelation of aliens in Area 51. That's got to snap your head towards what's important.
Is there even one of us who, if we owned the Chukchi Sea, would not sell it for $5 T? Or a tenth of that?
If we accept that US political leaders won't and can't seriously address climate change, what then has to happen?
Once again I came across a claim like this one on Roy Spencer's blog:
"CO 2 is a trace gas in the atmosphere and insignificant by definition."
Of course that's false -- without atmospheric CO2 the Earth's surface would be below the freezing point of water -- but I thought I would compare it to ozone, also a "trace gas."
Atmospheric ozone helps blocks strong ultraviolet light (UV-C) and most of UV-B, which would kill most animals who live on land. (I guess it might depend on how thick their skin is. And turtles? Snails?) Life might never have developed past the stage where the first ocean animal crawled out onto land, whoever's brilliant idea that was.
Wikipedia says atmospheric ozone's concentration is 0.6 ppm, 700 times less than CO2's. But what is its concentration in the "ozone layer?" I couldn't resist a little calculation to figure it out.
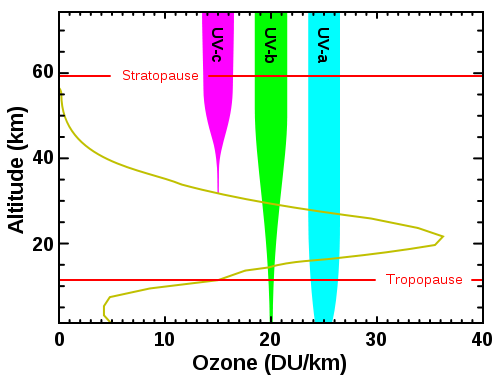
To the right is a nice graph of ozone's concentration with altitude. It peaks at about 20 km in height, where its concentration is 36 DU/km.
DU is "Dobson unit" -- "One Dobson unit refers to a layer of gas that would be 10 µm thick under standard temperature and pressure."
One DU is 2.69×10¹⁶ ozone molecules per square centimetre, or 2.69×10²⁰ per square metre.
So 36 DU/km works out to 9.7×10¹⁸ ozone molecules per cubic meter.
What is the density of air at that altitude? 0.088 kg/m3, according to this handy Standard Atmosphere Calculator. Dry air has a molecular weight of 28.97 grams per mole, so the mass of one air molecule is 4.8×10⁻²⁶ kg.
So at 20 km in altitude, there are 1.8×1024 air molecules per cubic meter.
Dividing one molecule number by the other finds that ozone's concentration at that altitude is 5.3×10⁻⁶, or 5 ppmv.
So ozone's maximum concentration is about 80 times less than CO2, and without this "trace gas" we'd be dead. Or never have existed in the first place, unless it developed underground or quickly developed some extremely strong sunscreen lotion.
As Shakespeare wrote, "the dose makes the poison." It's not the amount of something you have, it's its effect that kills you.
Ozone concentrations are greatest between about 20 and 40 kilometres (66,000 and 131,000 ft), where they range from about 2 to 8 parts per million.
--- Aside: If animals never left the ocean, could a technological civilization ever have developed? What might intelligent aquatic species like dolphins and octopi evolve into in another billion years? There were are the Xindi-Aquatics on Star Trek Enterprise, who seemed to have ships of their own, filled with water (and a small room for communication with nonaquatics). How could all that technology have developed in a water environment? How would you develop electronics? Or what would replace electronics if you couldn't escape the water -- maybe some kind of machines that worked by some kind of pumps pushing water...somewhere.